Black Swan Data: Redesigning a market intelligence platform so humans — not data scientists — could make the decisions
Pepsico
Heineken
Johnson & Johnson
Mitsui
Cosnova
Conagra
2 yrs
Embedded with Black Swan Data's product team
6+
Global enterprise clients using the redesigned platform
0→1
Self-serve insights and concept development, no data science required
Role
Senior Product Designer
Duration
2 years
Scope
Research · Product Design · Data Visualisation · UI
Gallery
The problem
Black Swan Data scrapes and analyses social platform data at scale to surface consumer trends for some of the world's largest FMCG brands. The data was genuinely powerful. The platform that delivered it wasn't.
The existing interface had been built for data scientists — dense query outputs, raw trend tables, and visualisations that required significant analytical expertise to interpret. But the people who needed to act on the insights weren't data scientists. They were brand managers, innovation leads, and strategy teams who needed to walk into a stakeholder meeting and confidently say: here's what's happening in the market, and here's what we should do about it.
Users weren't struggling with the data. They were struggling with the question their stakeholders were actually asking — "so what does this mean for us?" The platform answered the wrong question extremely well.
The reframe that changed everything
The breakthrough in research wasn't a usability finding — it was a strategic one. Clients weren't using the platform to find definitive answers. They were using it to socialise ideas. The goal wasn't to produce the correct data-backed conclusion; it was to give a room full of stakeholders enough shared context to make a human decision together.
Once we understood that, the design problem shifted entirely. We weren't building a better data tool. We were building a better decision-making tool — one where the AI and data did the heavy lifting invisibly, and what surfaced to the user was ready to be discussed, shared, and acted on.
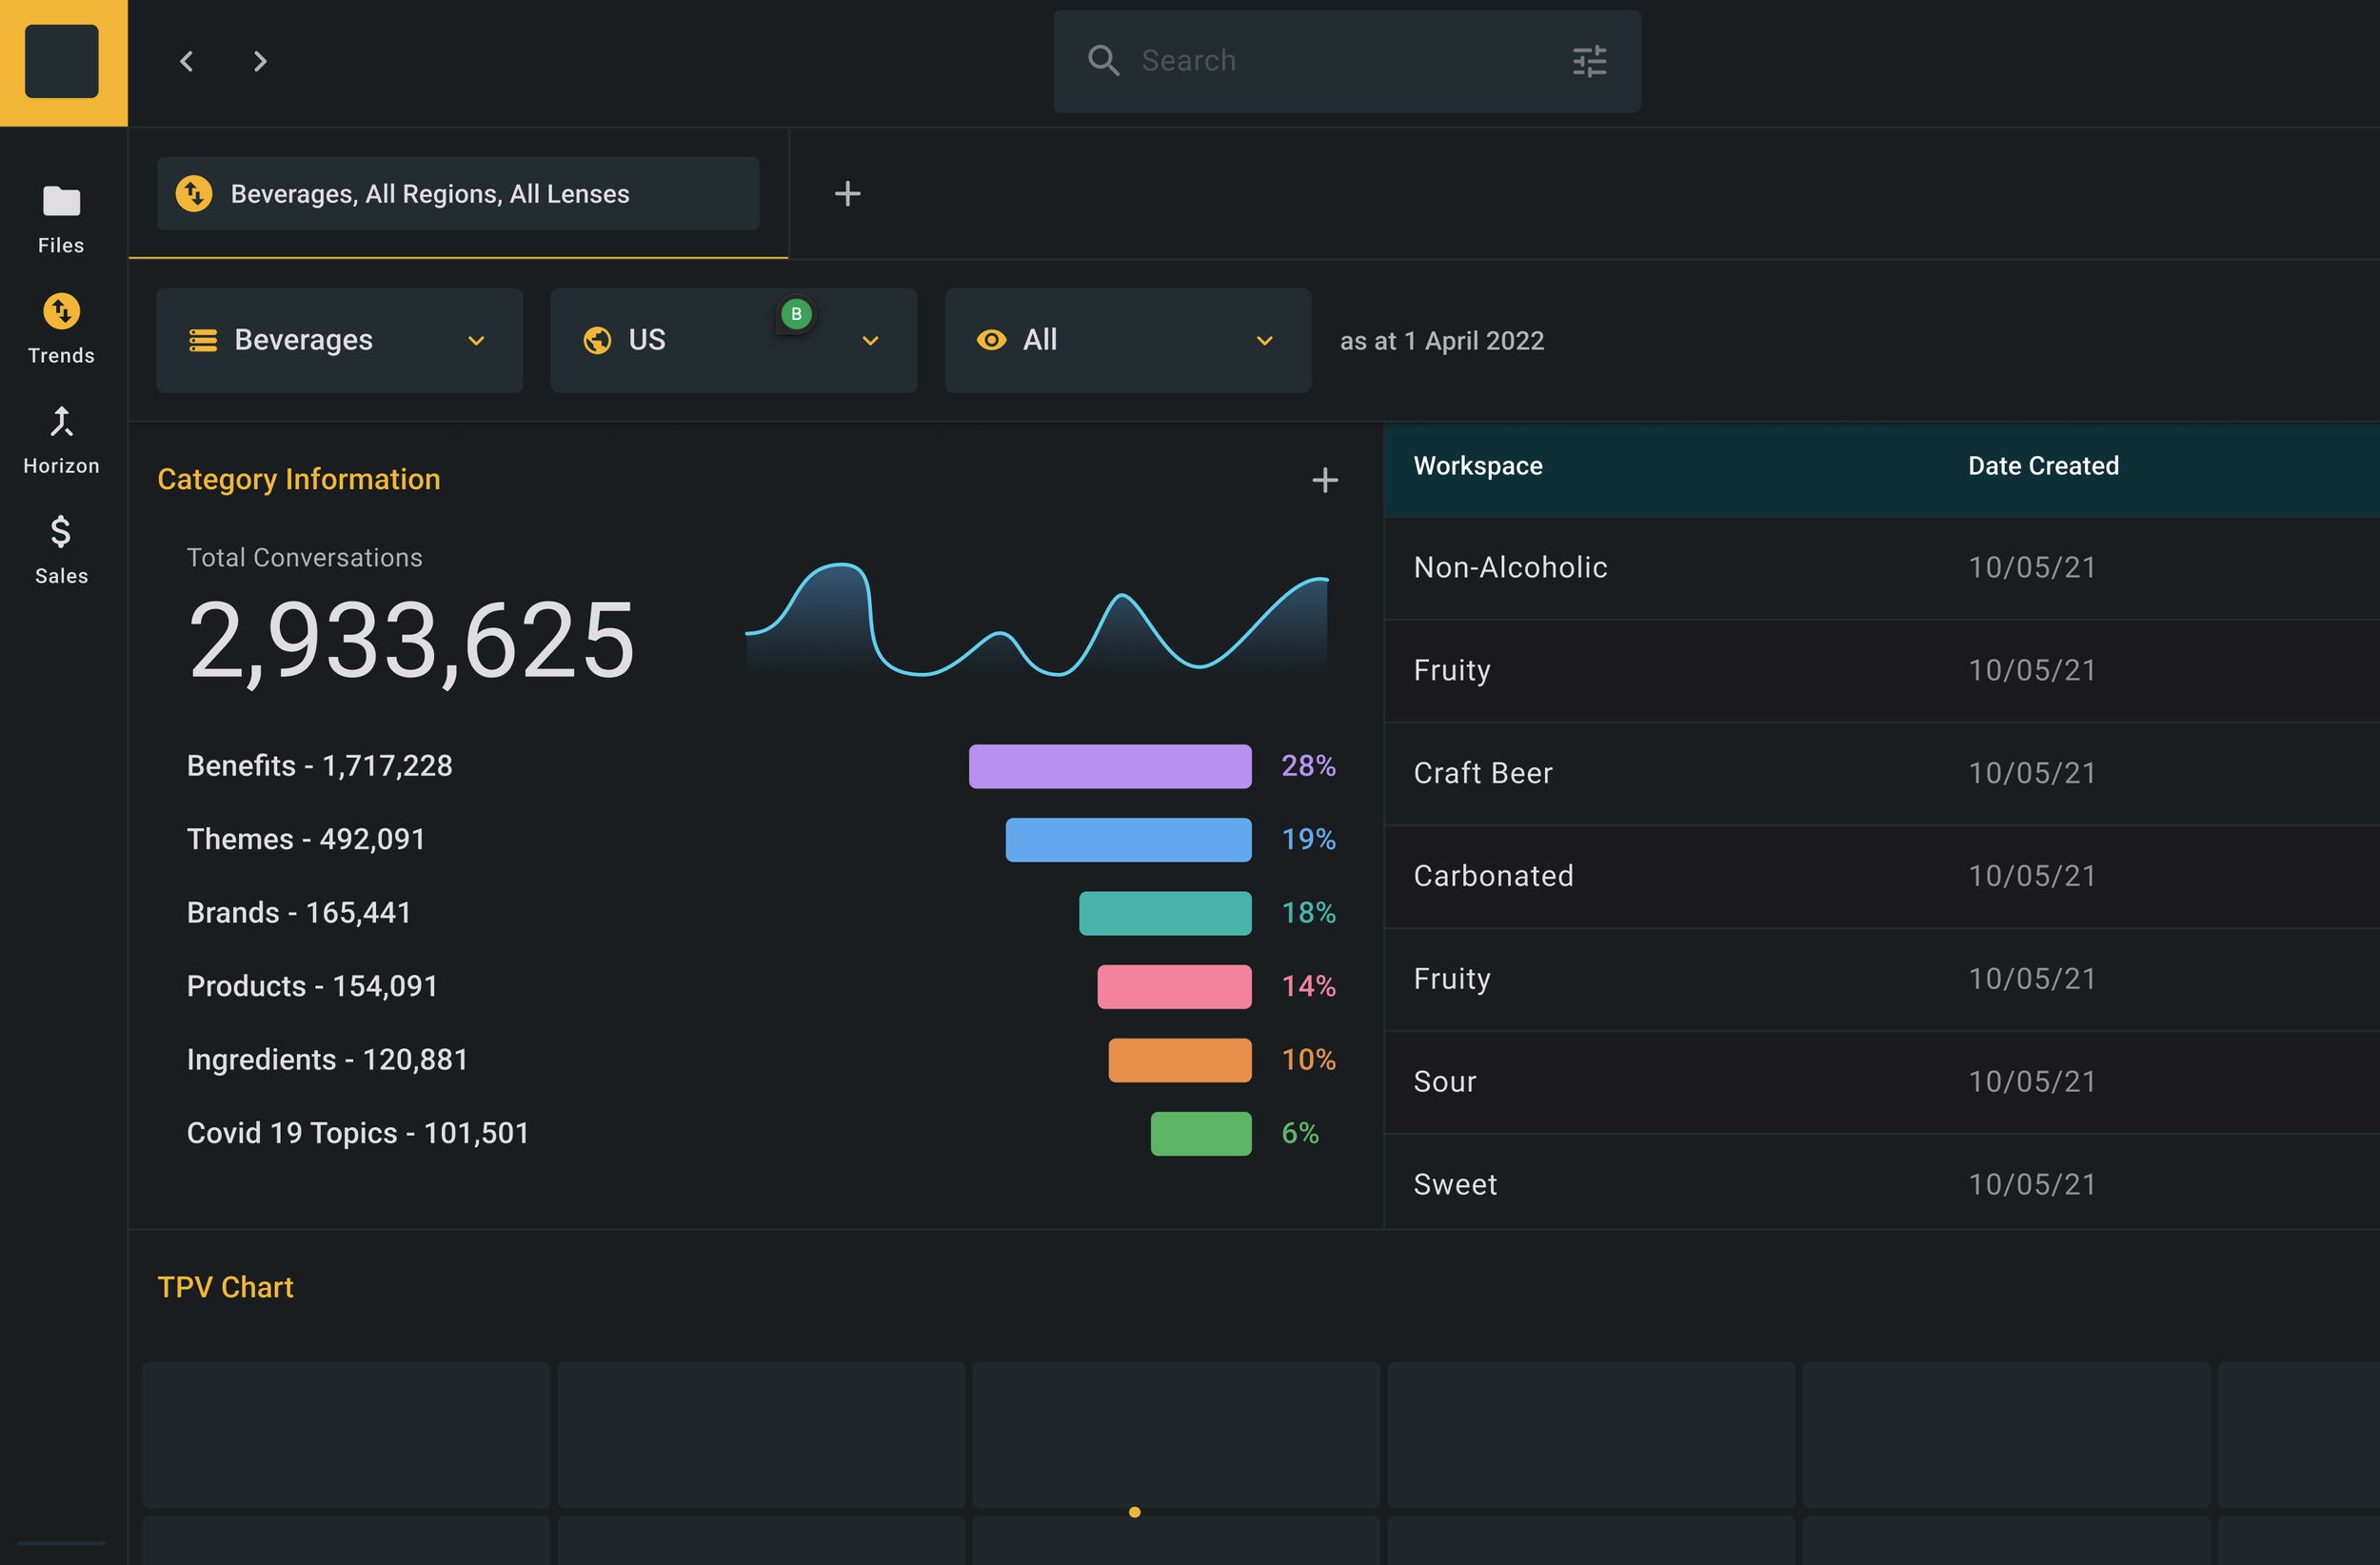
Before
Raw trend outputs and query results. Users spent hours combing through data trying to extract an insight they could defend in a meeting. High data science dependency, low confidence in the room.
After
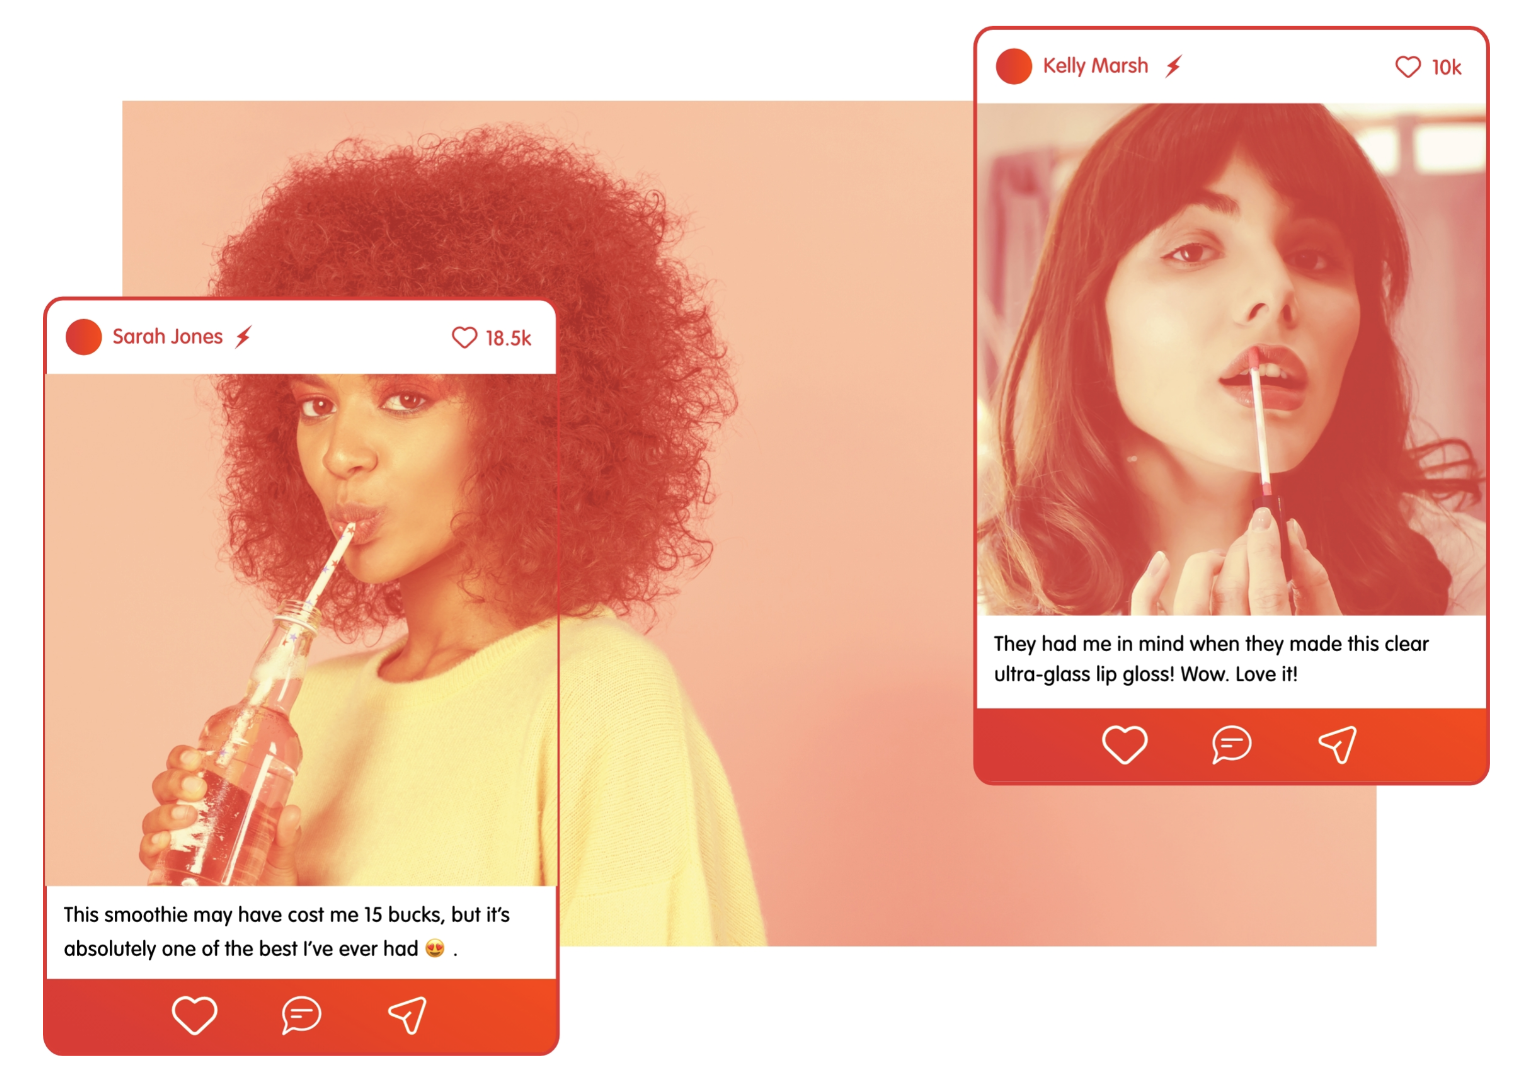
Plain language insight cards — each with a title, a summary, a rationale, and supporting trend data when needed. Clients could go from platform to stakeholder presentation without a data scientist in the loop.
The "dataless insights" design system
The core of my contribution was designing what we called the dataless insights layer — a presentation system that translated AI-generated trend analysis into something a non-technical user could read, trust, and share.
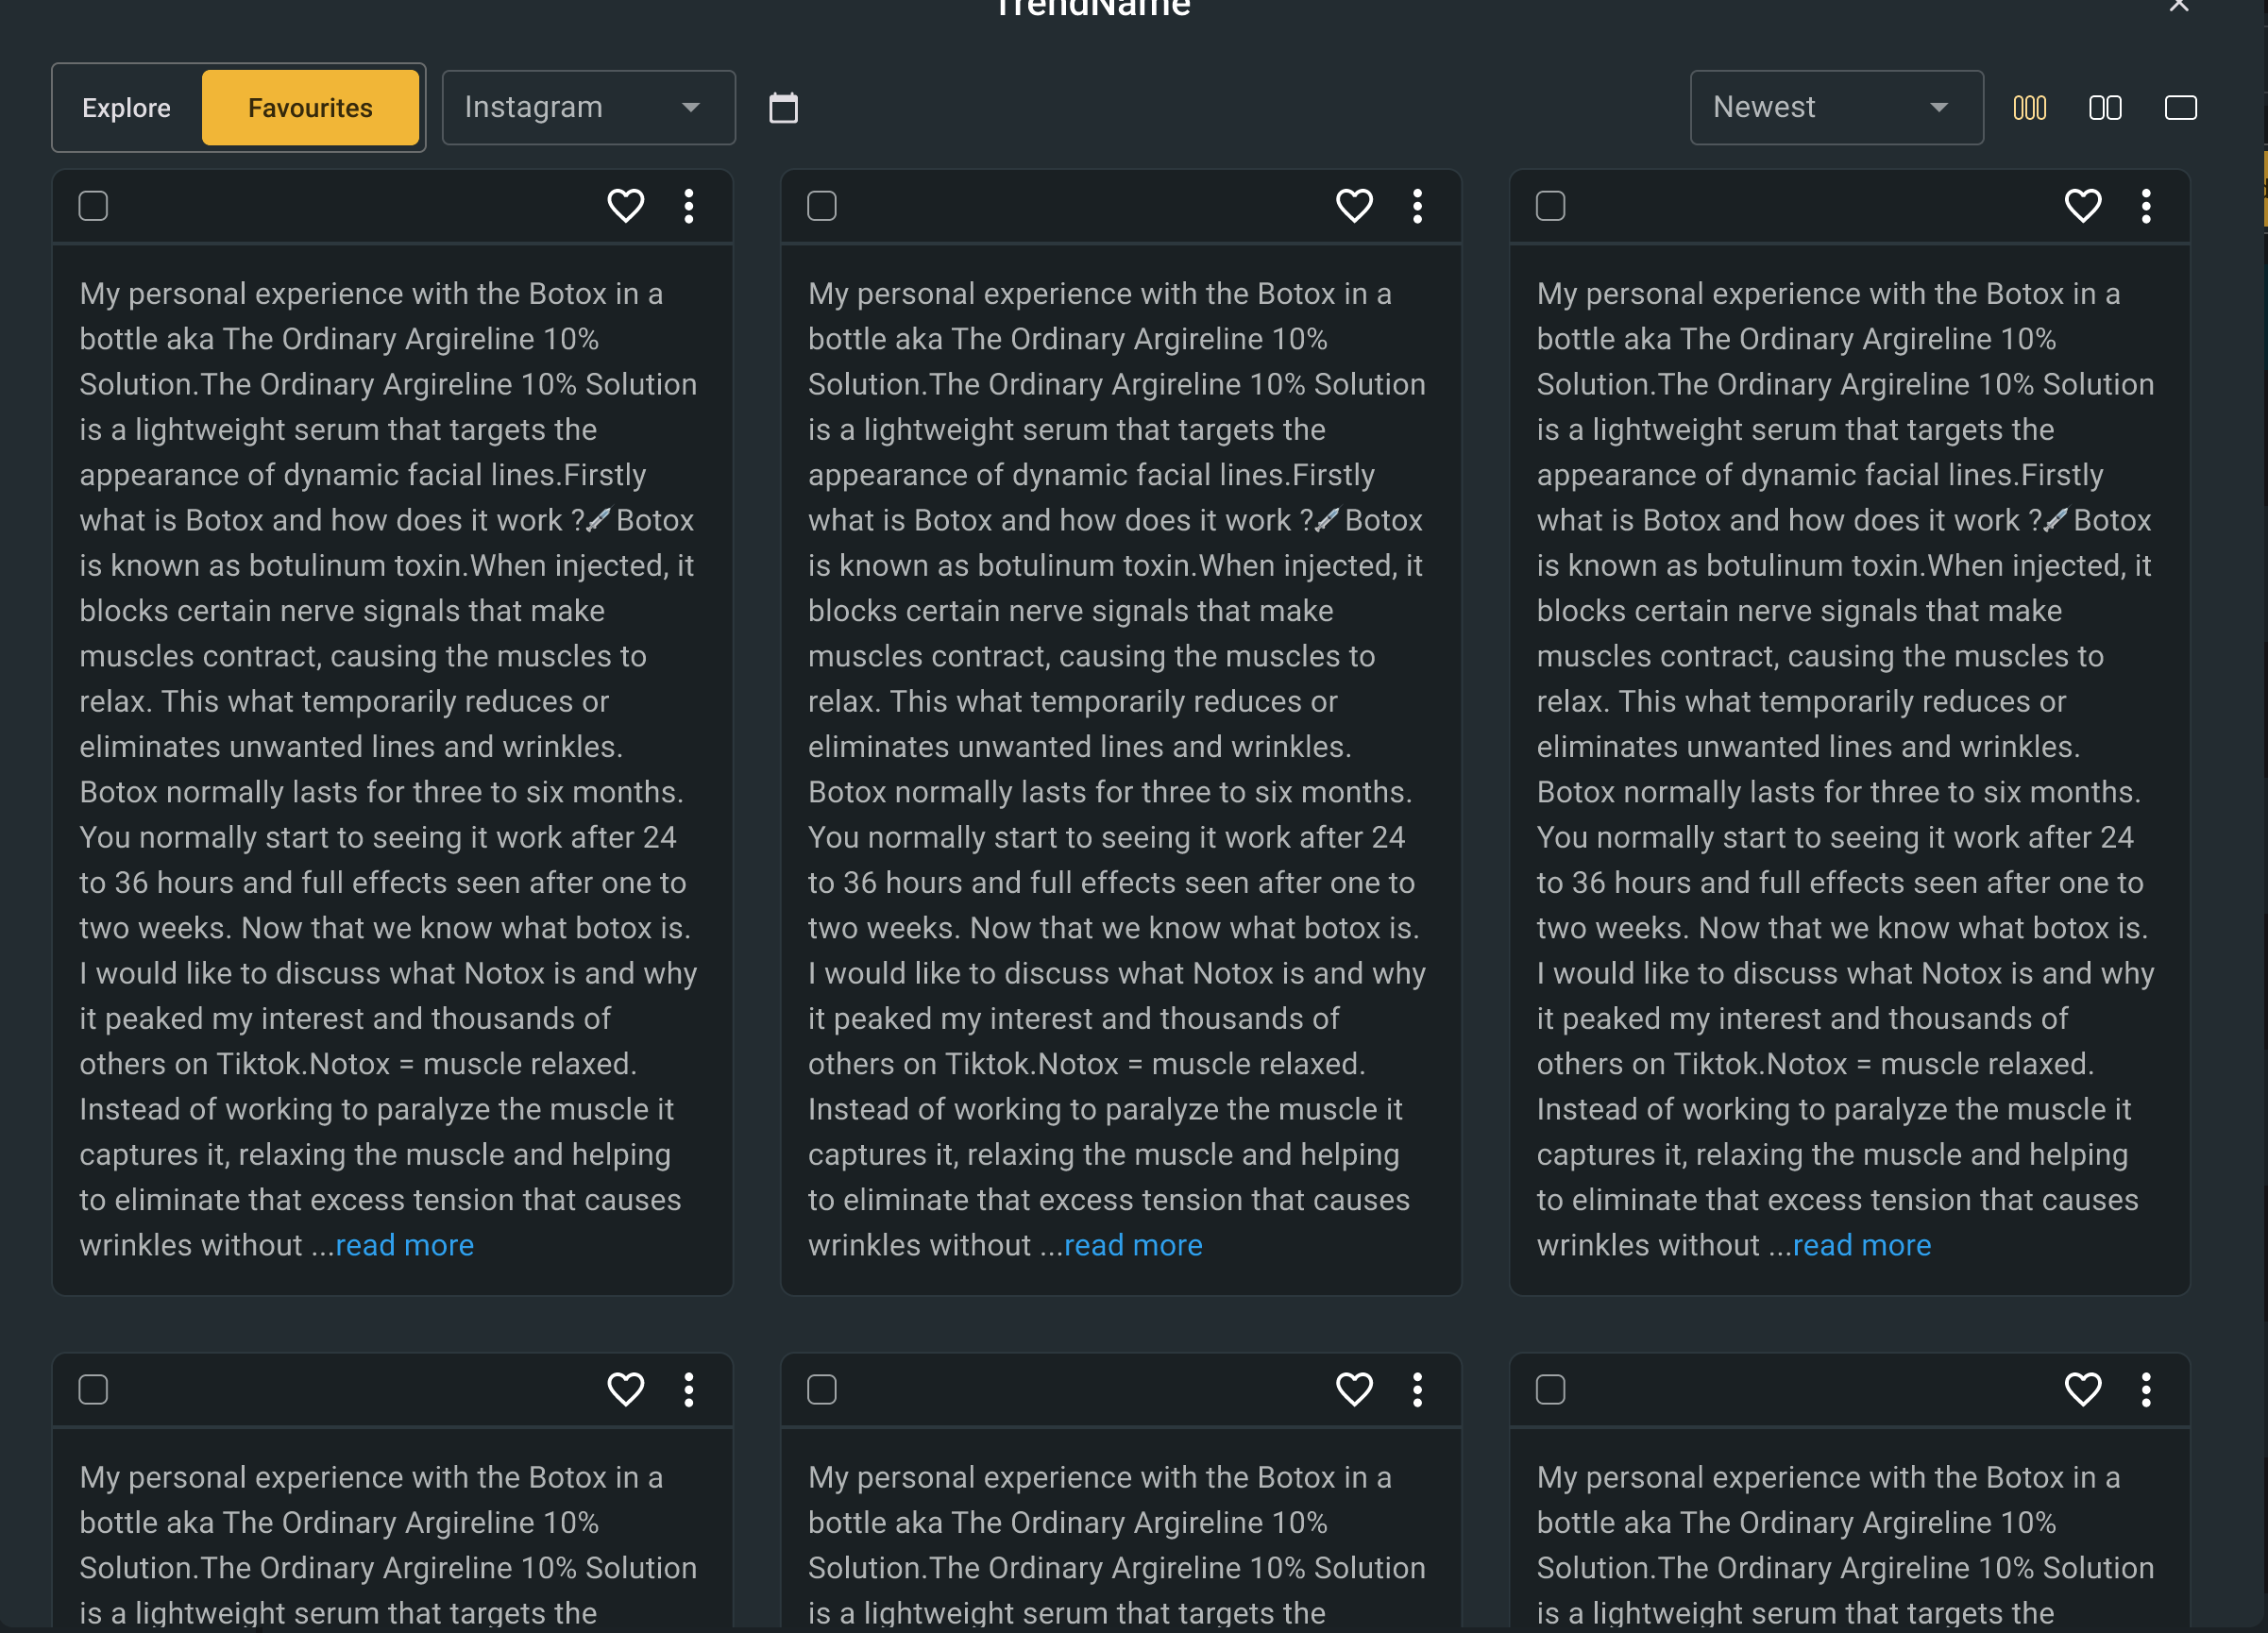
Plain language titles and summaries
Every insight led with a human-readable headline and a 2–3 sentence plain language summary. No jargon, no statistical qualifiers. The goal was that anyone in the room — regardless of their data literacy — could read it and understand what was being said.
Rationale as a first-class element
Below each summary, we surfaced the "why" — a short explanation of what signals in the data pointed to this insight. This was critical for stakeholder credibility. Users didn't just need to know what the trend was; they needed to be able to explain it when challenged. The rationale gave them that without requiring them to go back to the raw data.
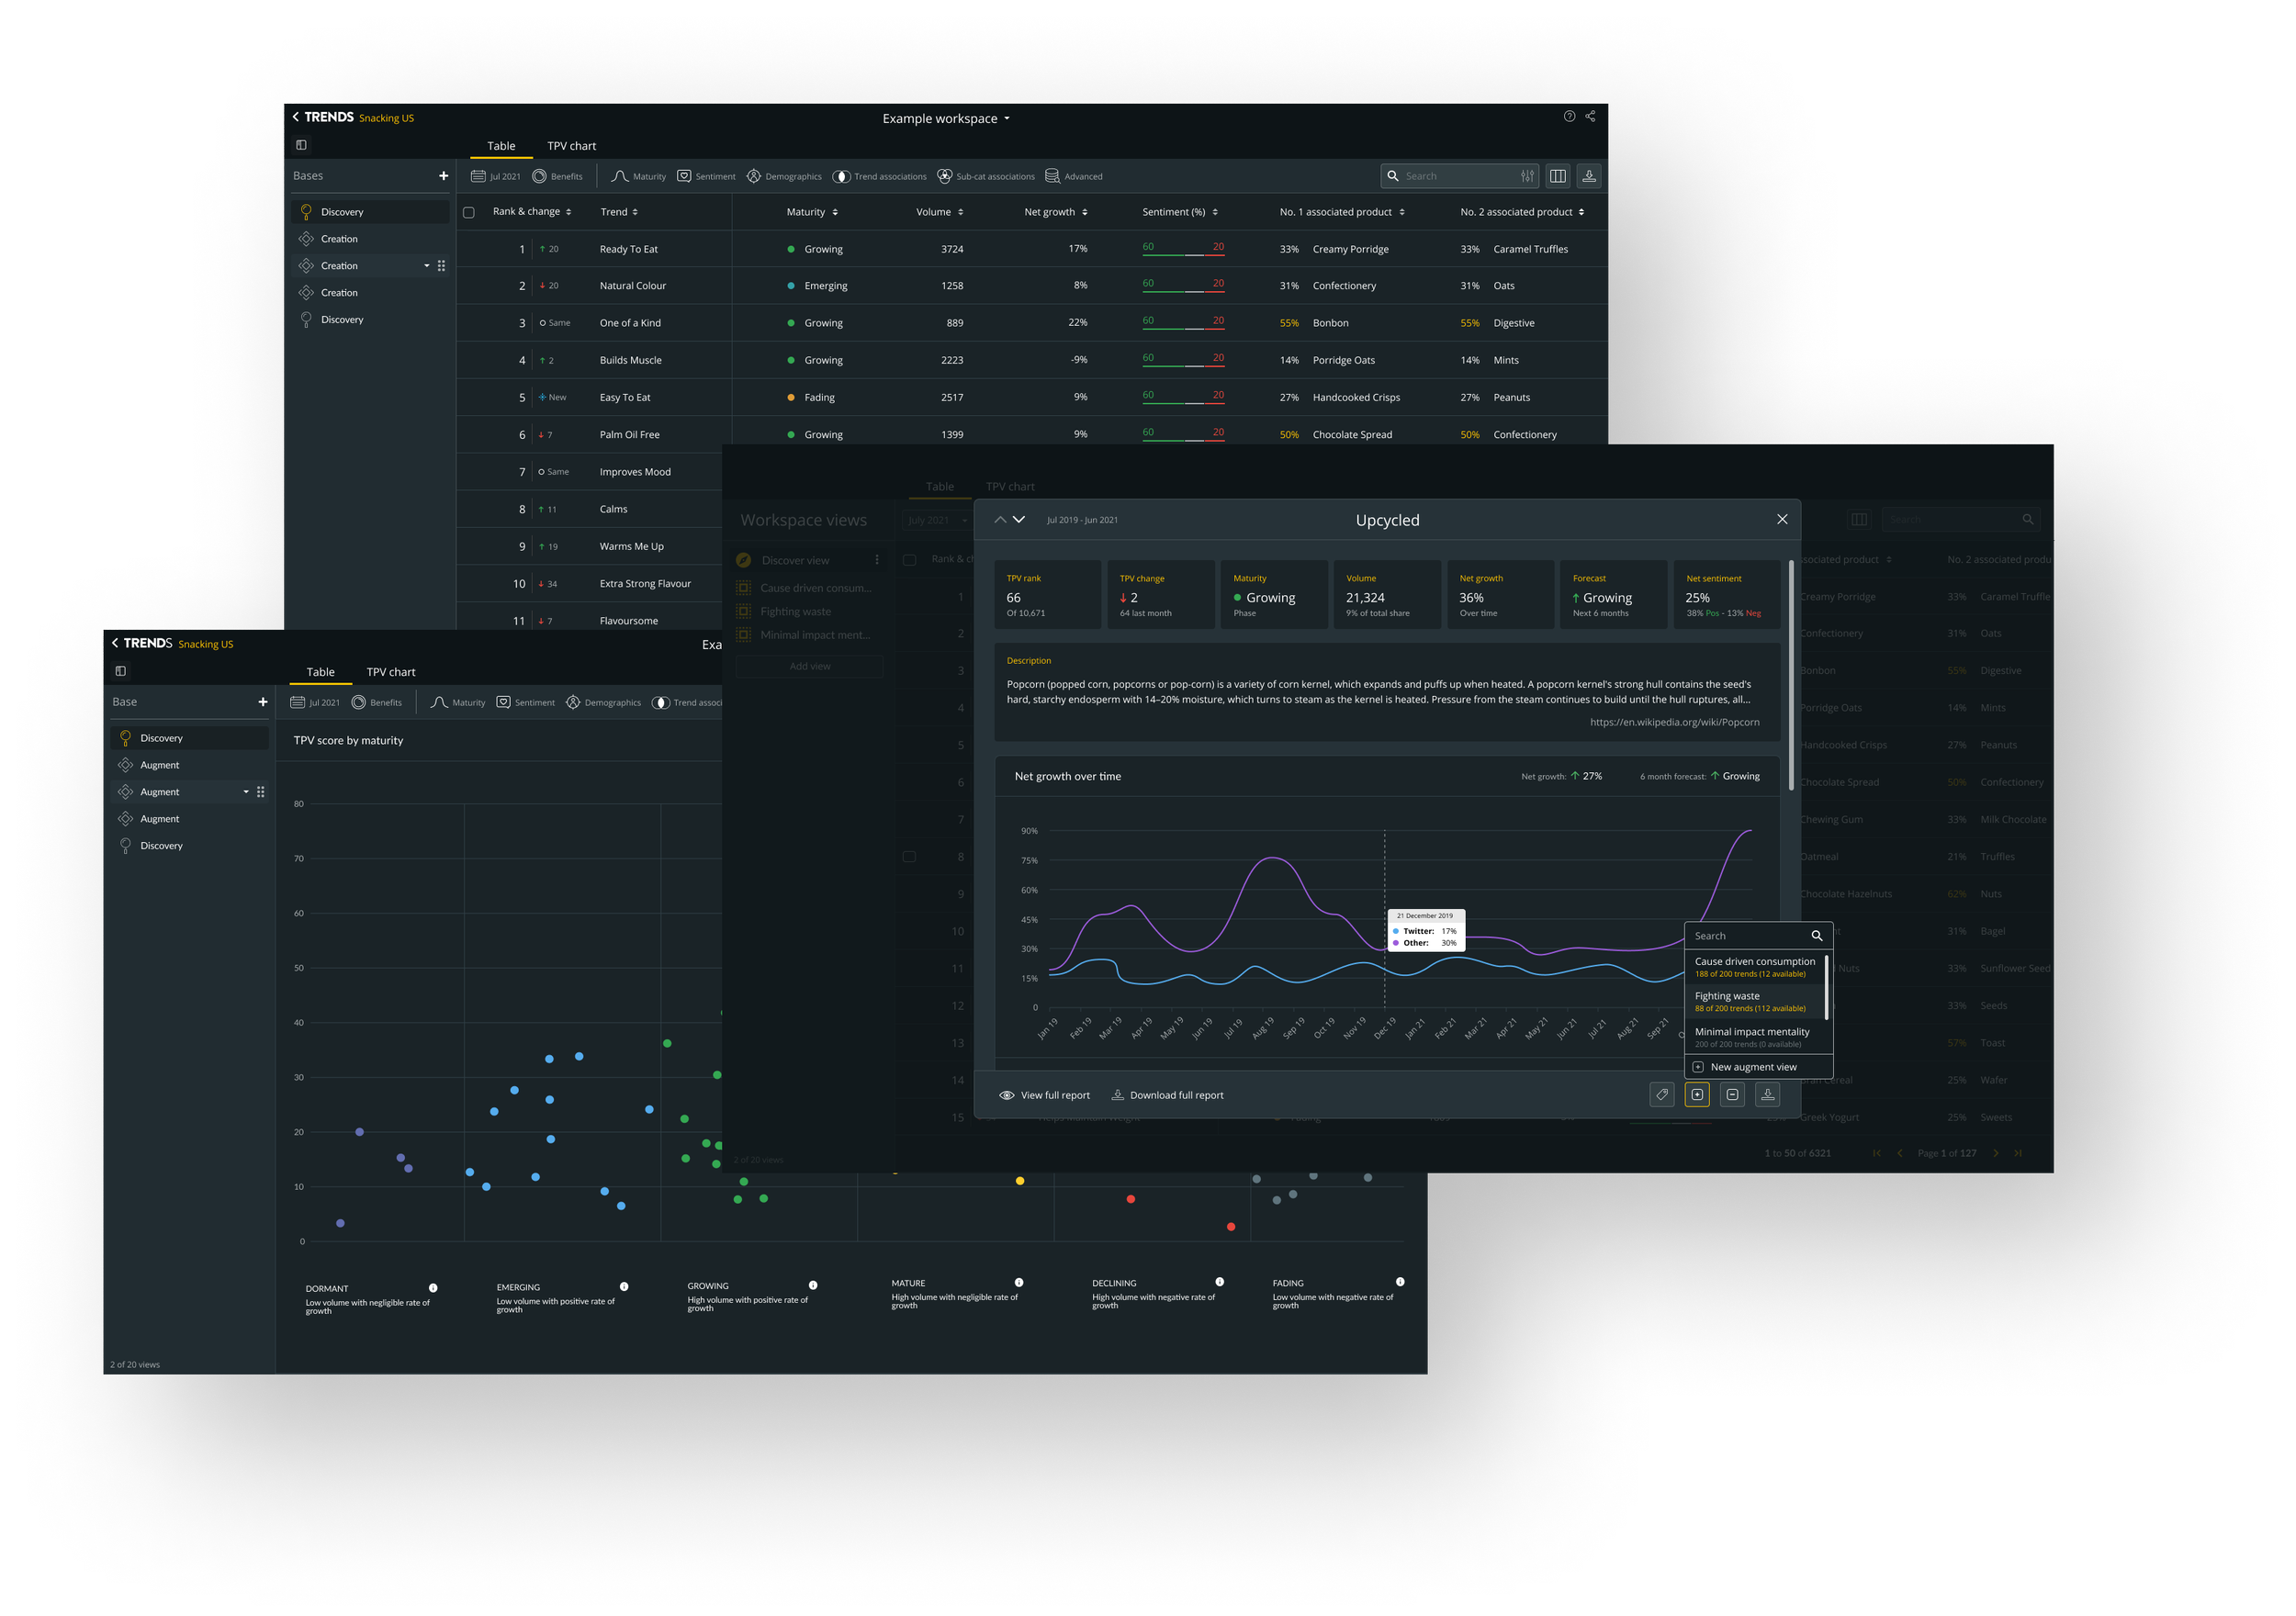
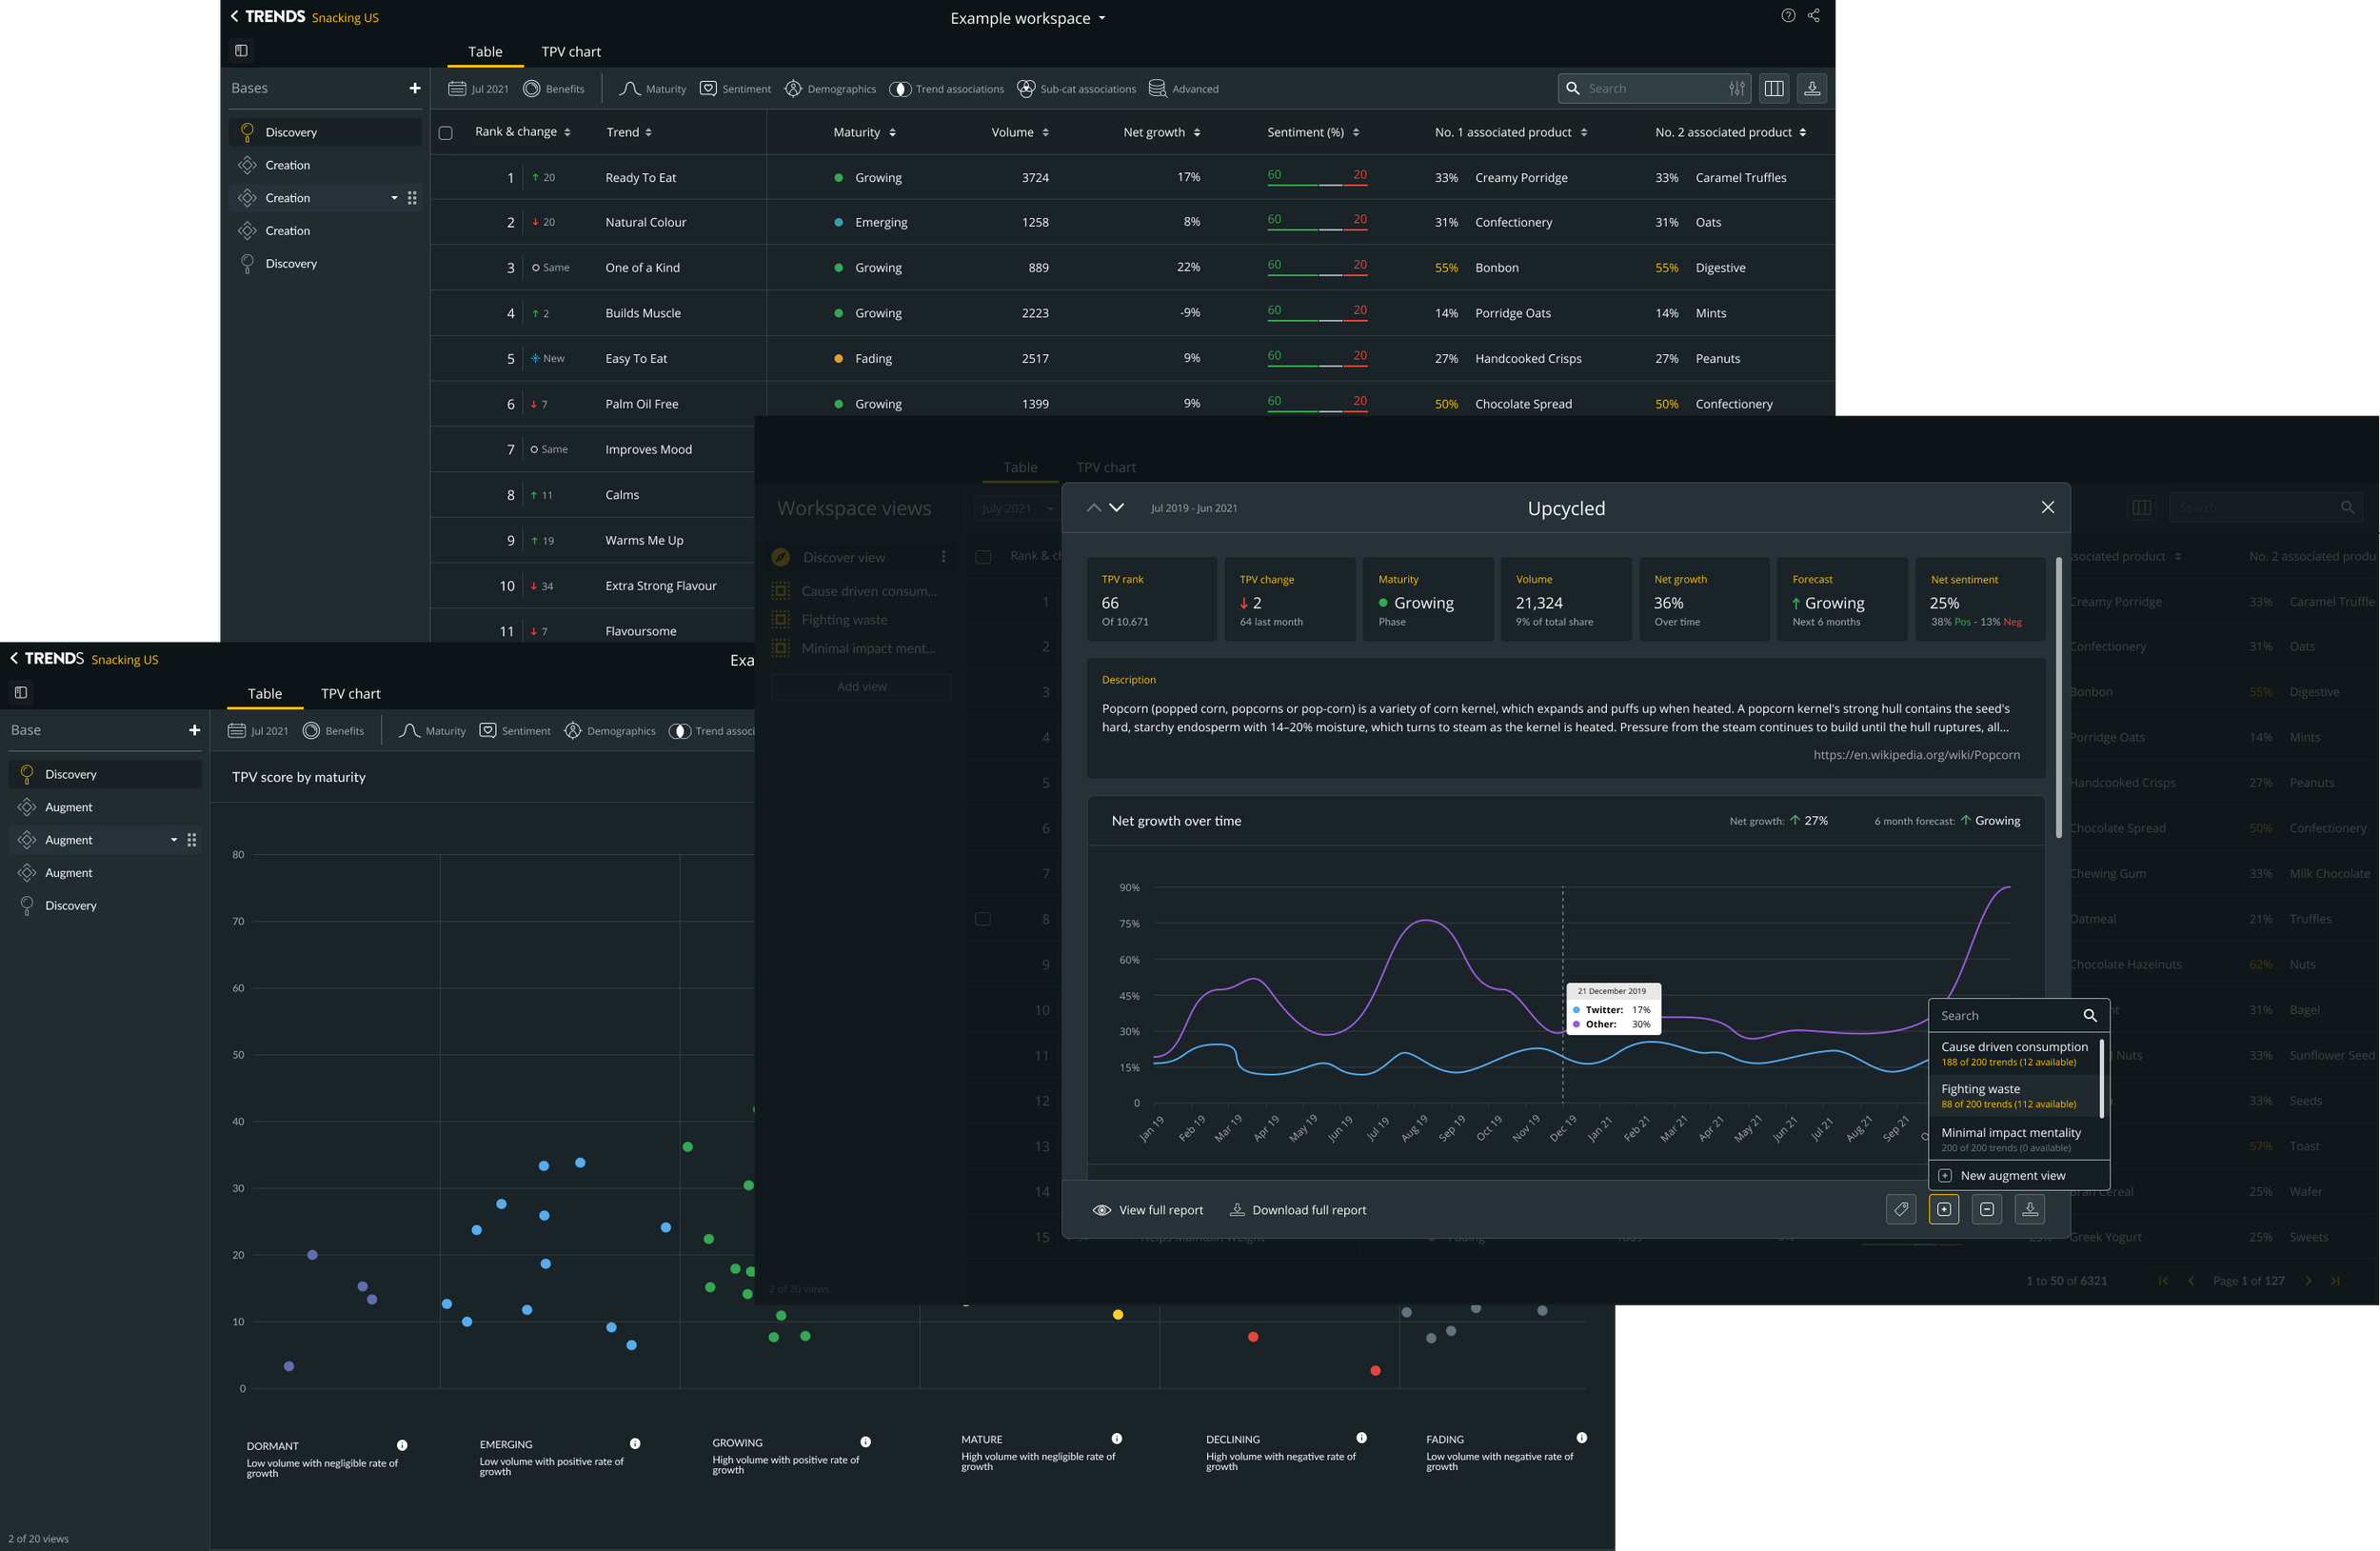
Charts as supporting evidence, not the hero
We flipped the visual hierarchy entirely. In the old platform, charts were primary and text was secondary. In the redesign, charts were contextual — they appeared when they added something the language couldn't convey on its own. This was a deliberate and contested decision: the data science team felt it de-emphasised their work. I had to make the case that trust in the data actually increased when it was presented selectively, because it signalled to users that every chart shown was worth their attention.
Self-serve concept development
Beyond insights, we built a concept development flow that let brand teams generate product or campaign concepts directly from trend data — without briefing an analyst. This was a net-new capability. For clients like Pepsico and Heineken, it meant innovation teams could explore territory independently and arrive at agency or internal strategy sessions with a point of view already formed.
The outcome
Client feedback after launch centred on one theme: teams were using the platform in meetings, not just before them. The shift from a research tool to a room-ready decision tool was felt immediately. For a B2B SaaS product, that change in usage pattern — from solo pre-work to shared in-session use — is a significant indicator of real adoption.
The concept development feature became a key part of Black Swan Data's sales narrative with new enterprise clients, positioning the platform as a strategic partner rather than a data vendor.
What I'd do differently
The data science team's concern about de-emphasising charts deserved a more structured response than I gave it. I won the argument with logic, but I should have brought them into the design process earlier — run sessions where they could see users interacting with both approaches in real time. The conclusion would have been the same, but the buy-in would have been stronger and the rollout smoother.